


Mouse-over the figure to see a larger version. Please allow a little time for the larger image to download.
Click on any of the figures to view a large version in a separate window.
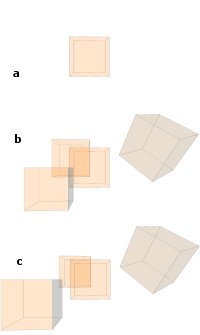
Figure 12.1. Example configurations and uses of ProximitySensor: (a) a single ProximitySensor, (b) multiple independent ProximitySensors, and (c) a single ProximitySensor with multiple instances.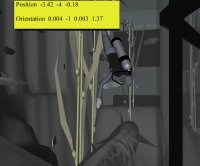
Figure 12.2. ProximitySensor reporting position and orientation in a Heads-Up Display (HUD), stabilizing HUD screen location.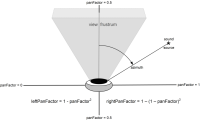
Figure 12.3. Stereo-panning algorithm for attenuation of sound intensity is based on the azimuth angle relative to the users current view direction.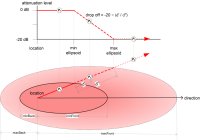
Figure 12.4. Sound ellipsoids correspond to linear spatialization boundaries for attenuation of Sound node intensity.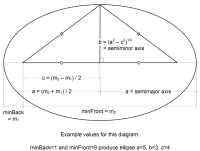
Figure 12.5. Derivation and example values for an ellipse semiminor axis, given focus location and front/back distances. The upper plot shows intensity values corresponding to boundaries in the lower diagram.- Image Not Available - Figure 12-06
Figure 12.6. Derivation of ellipsoid minHalfWidth and maxHalfWidth. 
Figure 12.7. Boundary regions are shown for the Sound node. In this example, the outer region is an ellipsoid, and the inner region is a sphere.
Portions of this work are from the book,
X3D: 3D Graphics for Web Authors, by
Don Brutzman and Leonard Daly, published by Morgan Kaufmann Publishers,
Copyright 2007 Elsevier, Inc. All rights reserved.
Web site copyright © 2008-2017, Daly Realism and Don Brutzman