


Mouse-over the figure to see a larger version. Please allow a little time for the larger image to download.
Click on any of the figures to view a large version in a separate window.

Figure 7.1. Event-animation chain connecting trigger, clock, event-producer node, and event-consumer node. Depending on an authors design, trigger nodes (such as TouchSensor) are not always needed.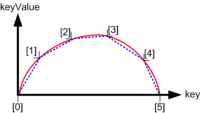
Figure 7.2. A piecewise-linear approximation (dotted line) of a smooth curve (solid line).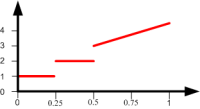
Figure 7.3. A step-wise discrete function, showing step values and discontinuities in the output.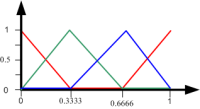
Figure 7.4. Respective RGB values produced as output from an example ColorInterpolator node.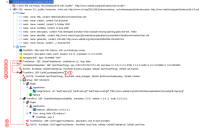
Figure 7.5. Example animation scene graph providing continuous rotation values for the Hello World example, built using the 10-step animation chain construction process.
Figure 7.6. Snapshot view of rotating Hello X3D Authors example.- Image Not Available - Figure 07-07
Figure 7.7. Piecewise-linear interpolation algorithm for X3DInterpolatorNode computations, expressed in pseudocode. - Image Not Available - Figure 07-08
Figure 7.8. Two-way weighted averaging is used to compute interpolation-output results from matched key and keyValue arrays. 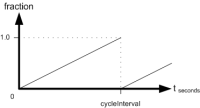
Figure 7.9. TimeSensor fraction_changed varies over the range [0,1] for each cycleInterval repetition.- Image Not Available - Figure 07-10
Figure 7.10. TimeSensor fraction_changed output algorithm, expressed in pseudocode. 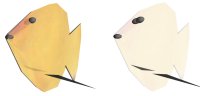
Figure 7.11. ScalarInterpolator is used to modify the transparency of the Garibaldi. This shows the fish at two different times. The left image is nearly fully opaque, and the right one is partially transparent.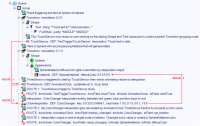
Figure 7.12. ColorInterpolatorExample scene graph displayed by X3D-Edit and annotated with overlaid ROUTE connections.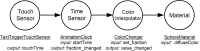
Figure 7.13. Event chain for ColorInterpolator example found in Figure 7.12.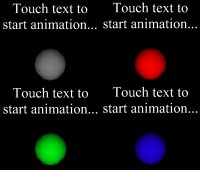
Figure 7.14. Successive views of ColorInterpolator example.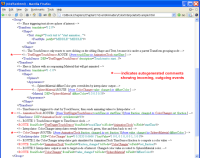
Figure 7.15. Pretty-print HTML page showing ColorInterpolator example, launched via X3D-Edit. Autogenerated comments are inserted that document ROUTE connections for events. DEF and USE names are linked by bookmarks to referenced nodes of interest.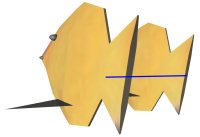
Figure 7.16. PositionInterpolator moves the fishs tail along a the blue straight line (enhanced for printing). The right fish is at the starting position. The left fish is shown a little time later.- Image Not Available - Figure 07-17
Figure 7.17. Using graphs to plan out and compute values for a PositionInterpolator approximation for a bouncing Box. 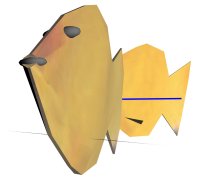
Figure 7.18. OrientationInterpolator combined with the previous PositionInterpolator moves the Garibaldi. The forwardfacing fish is at a later animation time than the fish on the right. The straight blue line indicates the nonrotated path of the tail.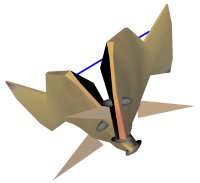
Figure 7.19. The fishs wiggle is added into the animation. The superimposed image shows the fish at two different times with different shapes to its tail. The enhanced blue straight line is the path of the fishs tail.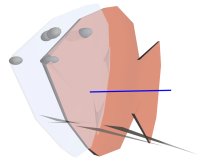
Figure 7.20. Combination animation showing ScalarInterpolator, ColorInterpolato, PositionInterpolator, OrientationInterpolator, and CoordinateInterpolator in a superimposed image. The transparent blue fish is closer to the viewer and occurs at a different time than the opaque reddish fish.
Portions of this work are from the book,
X3D: 3D Graphics for Web Authors, by
Don Brutzman and Leonard Daly, published by Morgan Kaufmann Publishers,
Copyright 2007 Elsevier, Inc. All rights reserved.
Web site copyright © 2008-2017, Daly Realism and Don Brutzman